STM Studio helps debug and diagnose STM32 applications while they are running by reading and displaying their variables in real-time.
Running on a PC, STM Studio interfaces with STM32 MCUs via the standard ST-LINK development tools.
STM Studio is a non-intrusive tool, preserving the real-time behavior of applications.
STM Studio perfectly complements traditional debugging tools to fine tune applications.
It is well suited for debugging applications which cannot be stopped, such as motor control applications.
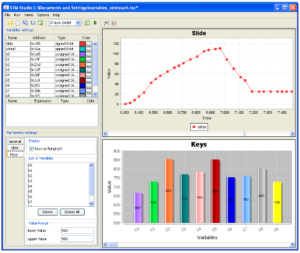
Different graphic views are available to match the needs of debugging and diagnosis or to demonstrate application behavior.
- Key Features
- Runs on PCs with Microsoft® Windows XP, Vista and Windows 7 OS
- Connects to any STM32 via ST-LINK (JTAG or SWD protocols)
- Reads on-the-fly (non intrusive) variables from RAM while application is running
- Parses DWARF debugging information in the ELF application executable file
- Two types of viewer:
- Variable viewer: real-time waveforms, oscilloscope-like graphs
- TouchPoint viewer: association of two variables, one on the X axis, one on the Y axis
- Possibility to log data into a file, and replay later (exhaustive record display, not real-time)
Here there is a very nice STMStudio Tutorial (by: Gidi M.)